4. How to Segment Users for Experiment Distribution
Get advanced filtering control over your experiments
This article shows you how to use Taplytics' powerful user-segmentation controls and allows you to target an experiment to a very specific segment of your users.
If you haven't done so already, take a look at how to set up the different types of Experiments through the Taplytics dashboard.
There are three steps to completing the Distribution section of your experiment.
- Experiment User Segment
- Experiment Variation Distribution Percentage
- Experiment Rollout
Each of these help you target and control the audience who will receive the experiment. Please see below for an overview of how to use and better understand each item.
1. Experiment User Segment
This is where you select the specific audience who will see your experiment.
Taplytics has several out of the box filters you can leverage. For a full description of all of the filters please find more info here: Taplytics Distribution Filters.

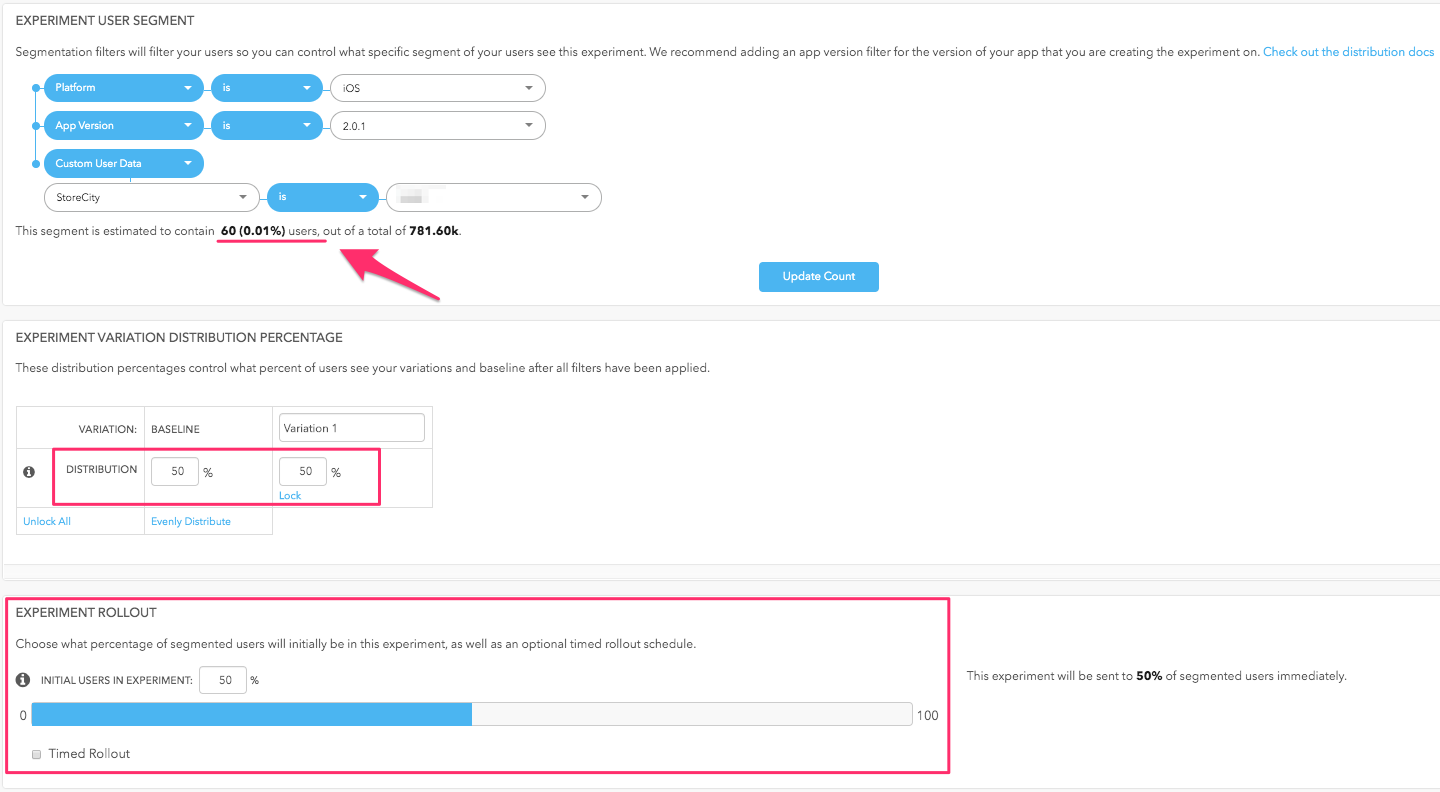
You can leverage several filters at once to narrow down your experiment audience and Taplytics will give you an estimate of the number of users who qualify for the experiment. For example, see the image below:

2. Experiment Variation Distribution Percentage
The distribution percentage controls the percentage of users who will be placed into variations.
The ideal set up for experiments is an even distribution percentage between all variations. This ensures that baseline and the variations have similar numbers of users and as a result, your experiment goals will reach statistical significance (chance of beating baseline) in a reasonable amount of time.

3. Experiment Rollout
The Experiment Rollout controls how many users within the variation will actually be shown the change.
For example, click on the image below and see how this experiment distribution is setup:

In the example above;
- A total of 60 users will be eligible for the experiment
- Based on the distribution percentage, approx. 30 users will be bucketed into baseline and 30 users will be bucketed into the variation because the percentage is set to 50/50
Assuming 30 users are in Variation 1 and with an Experiment Rollout set to 50%, only 15 users will SEE the actual variation. Only after you move the Rollout to 100% will all users who are in the variation actually be seeing the changes.
Most experiments start with a 100% rollout since the objective of experimentation is to determine which variation is performing better. In that case a 10% or 50% rollout isn't necessary.
But in some cases, you might be testing sensitive updates and would like to gauge your audience's reaction to the changes and therefore a rollout is a handy way to control access to a variation.
--
Keep moving through the experiment work flow!
What's next? You're at the last step! Review your experiment set up and launch it to users!
- Reviewing the experiment set up and launching it to users!
Updated over 5 years ago
