Statistical Significance and Error Control
Statistical significance is an essential part of experimental analysis, providing a quantitative measure of the likelihood that the observed difference between the baseline and variation in your experiment is not due to random chance.
Taplytics Experimentation employs two distinct statistical methods to assess the performance of your experiments depending on the type of goal you set: Z-Score and Two-Tailed T-Test.
-
Z-Score - is used for binary conversion goals such as button clicks or app sessions
-
Two-Tailed T-Test - is used for value optimization goals where the comparison is based on the difference between two average values.
It's important to note that each of these tests comes with its own set of assumptions. A Z-Test assumes that data is normally distributed and the sample size is large enough. If these assumptions are violated, the results of the Z-Test may not be reliable. On the other hand, a T-Test is more tolerant of smaller sample sizes and less severe deviations from normality, but it still assumes that the data are independent and identically distributed. Violations of these assumptions can also impact the reliability of the T-Test.
In Taplytics, a 95% confidence level is used in both types of goal evaluations, signifying that if there was no actual difference between your baseline and variation, less than 5% of your results would be as extreme as the observed result purely by chance.
Experiment Goal and Results
In the Taplytics platform, experiment results consist of experiment goals, with each goal comprising several elements. Here's a breakdown:
- Variation: This column reports the name of the variation for a particular row.
- Conversions / Sessions or Events: This column reports the number of conversion events received and the number of sessions or denominator events received.
- Event Average (if Numerical or Revenue Goal)
- Conversion Rate: This column shows the percentage of views that turned into conversions as well as the confidence interval.
- Confidence Interval (Standard Error): This number represents the expected range of values above and below the observed conversion rate assuming a 95% confidence level.
- Change: This column reports the percentage change of the Test variation compared to the Control variation.
- Chance of Beating Baseline: This column reports the significance, or how different the confidence interval for the conversion rate for the Test variation is when compared to the Control variation (this must be at least 95% confident before being flagged as significant). Once Chance of Beating Baseline hits 100%, you've reached statistical significance.
Binary Conversion Goals

Binary conversion goals, employ the Z-Score method, tracking the number of times an [event was triggered](https://docs.taplytics.com/docs/types-of-experiment-goals#code-event-goal) over a denominator.
Conversion Rate
Calculated as the ratio of conversion events to the total number of events you've set as the denominator, the default being app sessions. The conversion rate calculation is what you can use to gauge how well the variations and baseline are performing.
% Change
Determined by subtracting the Conversion Rate of the Baseline from the Conversion Rate of the Variation and dividing this by the Conversion Rate of the Baseline. The percentage change indicates how much better or worse each variation compared to the baseline.
Confidence Interval (Standard Error):
This number represents the expected range of values above and below the observed conversion rate assuming a 95% confidence level.
Chance of Beating Baseline
This figure may vary as your experiment collects more data. When the Chance of Beating Baseline reaches 100%, it signifies that the Variation has reached a 95% confidence level in relation to the Baseline.
Value Optimization Goals

For value optimization goals, a Two-Tailed T-Test is used. In Taplytics, revenue goals and Code Event goals that track the average of the selected code event’s numeric value are considered value optimization goals.
Event Average
This is the calculated mean of the event average.
% Change
This is determined by subtracting the Event Average of the Baseline from the Event Average of the Variation and dividing this by the Event Average of the Baseline.
Confidence Interval (Standard Error)
Standard methods for calculating Z-Scores are used here.
Chance of Beating Baseline
Similar to binary conversion goals, this figure can change as your experiment accrues more data. When it hits 100%, it confirms that the Variation has reached a 95% confidence level compared to the Baseline.
Real World Examples
Using Binary Conversion Experiment Goal and Calculation
Here is an example of experiment results for a Binary Conversion goal you get in the Taplytics platform:
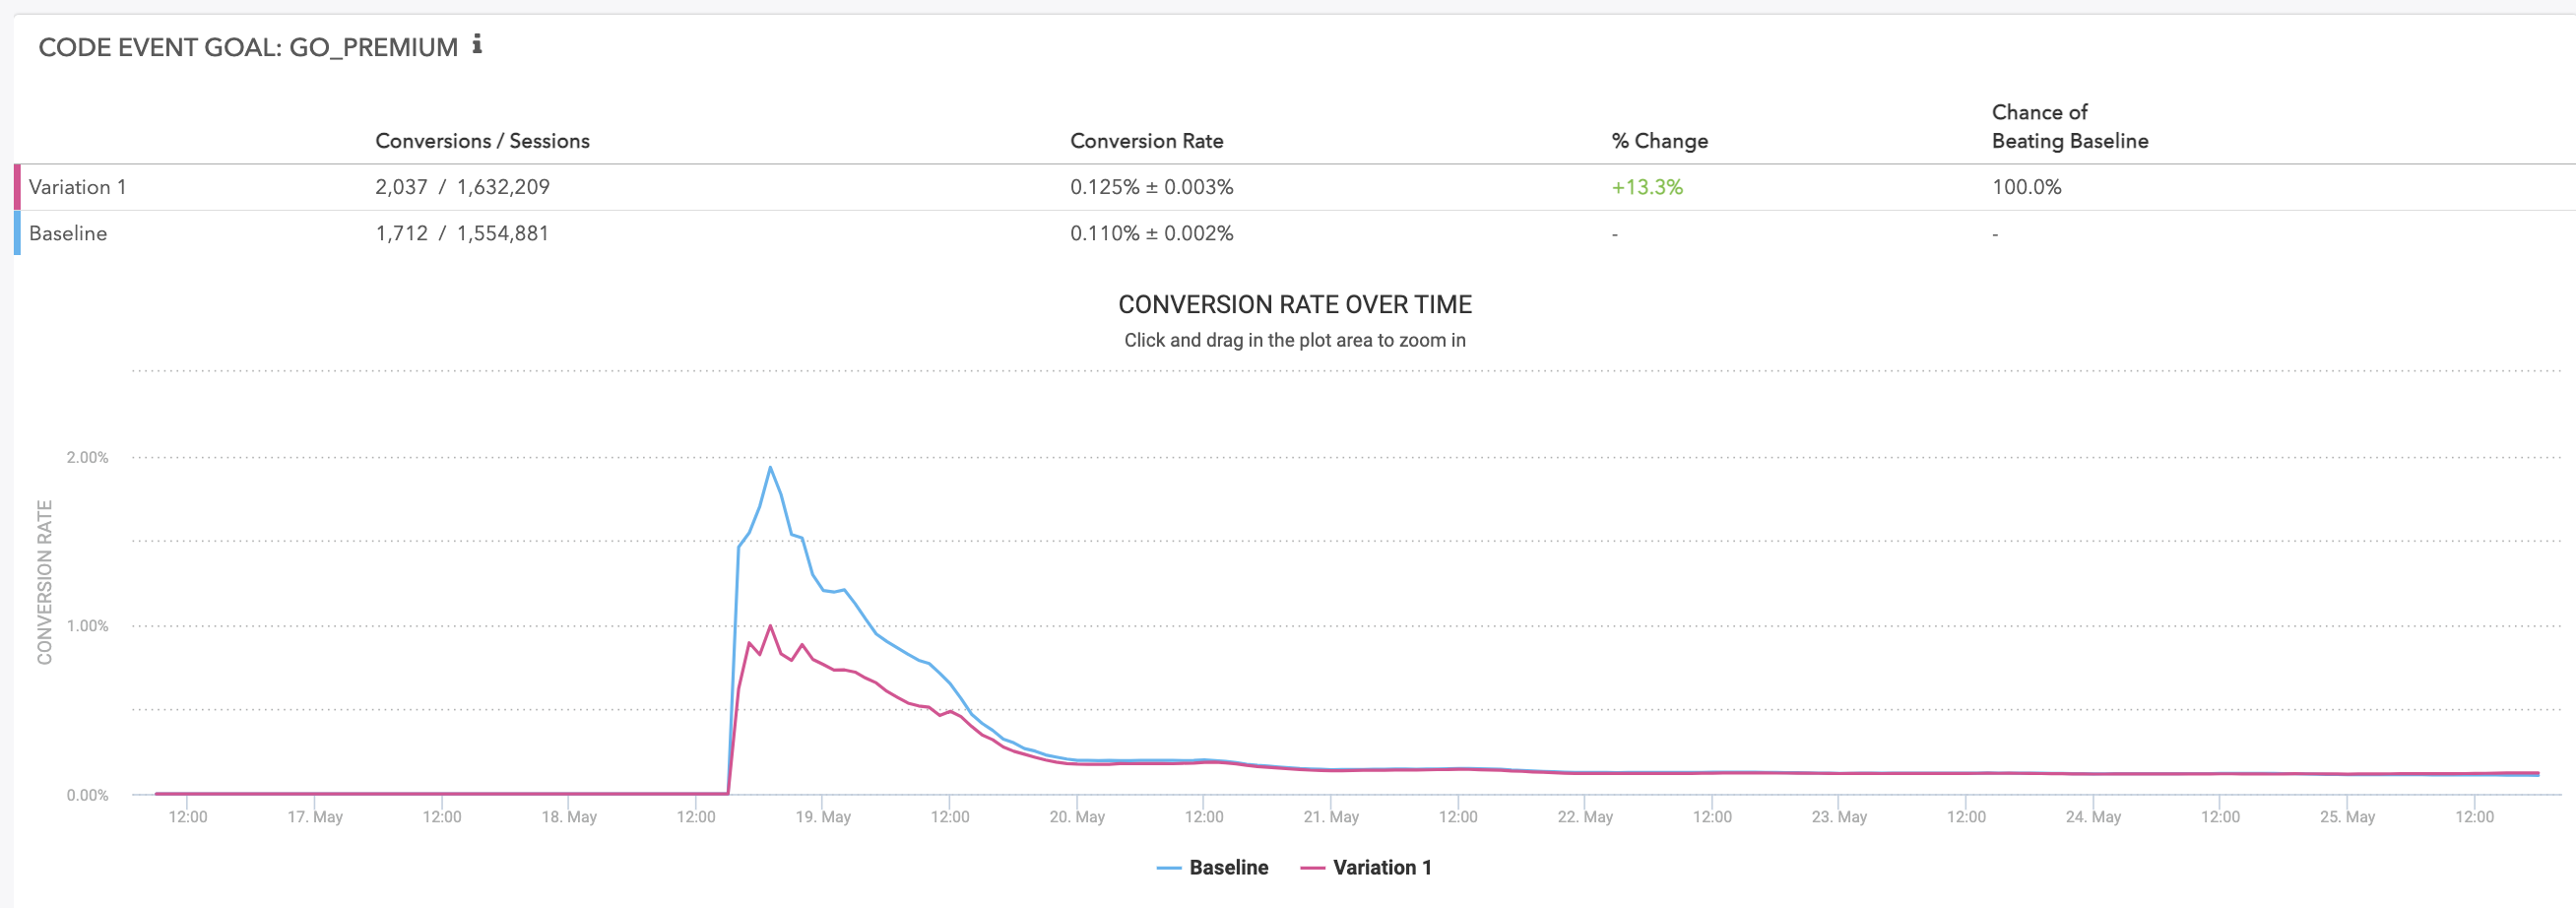
The values used in the report are calculated as follows:
Conversion rate (p): For each variation, the conversion rate is calculated as the ratio of conversion events to the denominator events.
p = (Conversions / Sessions) * 100
% Change: The percentage change of the conversion rate between the Test variation and the Control variation is calculated as:
Percentage Change = ((V_variation - V_baseline) / V_baseline) * 100
Confidence interval: A statistical method for calculating a confidence interval around the conversion rate is used for each variation. The standard error (for 1 standard deviation) is calculated using the Wald method for a binomial distribution:
SE = √(p(1-p) / sampleSize)
To determine the confidence interval for the conversion rate, multiply the standard error with the 95th percentile of a standard normal distribution (a constant value equal to 1.96), resulting in a 95% confidence that the conversion rate, p, is in the range of:
p ± (1.966 * SE)
Chance of Beating Baseline: Our statistical significance calculation that tells us if our experiment results are statistically significant at a 0.05 significance level or 95% confidence.
The values in the interface are represented as a percentage ranging from 0-100%.
To determine this value, we use a cumulative distribution function (CDF). A Cumulative Distribution Function (CDF) is a function that gives the probability that a random value is less than or equal to another value. For a standard normal distribution, this is often represented as Φ(x). It essentially provides you with the cumulative probability for a given x-value.
The standard normal distribution is a special case of the normal distribution. It is a continuous probability distribution where the mean is 0 and the standard deviation is 1. The standard normal distribution is useful because any normal distribution can be transformed to a standard normal distribution.
The formula for the CDF of the standard normal distribution is:
Φ(x) = 0.5[1 + erf(x/√2)
- Φ(x) is the cumulative distribution function of the standard normal distribution.
- erf(x) is the error function.
- x is a random variable from the standard normal distribution.
In Taplytics, the CDF is used in conjunction with p-value computation to determine if the observed difference is statistically significant. If the computed p-value is less than 0.05 significance level, you reject the null hypothesis (which assumes no difference between A and B) and conclude that the difference is statistically significant.
Understanding Errors in Experimentation
In Taplytics Experimentation, just like any controlled experiment, you should anticipate three possible outcomes:
- Accurate results – When there's a genuine difference between baseline and the variation, the data reflects a winner or a loser accordingly. Conversely, when there's no significant difference, the data shows an inconclusive result.
- False-positive (Type I Error) – Your test data shows a significant difference between your original and variation, but it’s merely random noise in the data; there's no real difference between your original and your variation.
- False-negative (Type II Error) – Your test shows an inconclusive result, but your variation is genuinely different from your baseline.
Taplytics ensures an optimal balance between experiment sensitivity and reliability. We enable product and engineering teams to make informed, data-driven decisions, and ultimately, empower them to continuously improve and enhance user experience based on trustworthy insights.
Remember, the statistical tests used in Taplytics, and in A/B testing in general, provide a mathematical framework to make informed decisions. However, like all statistical tests, they are not infallible and are based on certain assumptions. Violations of these assumptions can lead to misleading results. It's crucial to understand the conditions of the tests and ensure that your data meets those conditions as closely as possible to draw valid conclusions from your A/B tests.
Updated about 2 years ago